
Precision ET
How I used AI to build a science‑grade irrigation engine — from competitive research and FAO‑56 algorithm development to native implementation across three platforms.
Transforming Residential Irrigation with Science & AI
Toro's residential irrigation app lacked science-backed watering intelligence. Competitors were catching up with weather-responsive scheduling, but none had implemented the gold-standard FAO Penman-Monteith model at consumer level. I saw an opportunity to build something unprecedented — and I used AI to do it, end to end.
I led the entire product lifecycle: competitive auditing of 8 market leaders, persona research, information architecture, algorithm development, design system creation, and native implementation across iOS (SwiftUI), Android (Jetpack Compose), and .NET admin tooling. Every step was AI-augmented — from synthesizing FAO-56 research papers to generating hundreds of design iterations and writing production code.
The result: Precision ET, a 7-step wizard that translates complex evapotranspiration science into a 15-minute setup experience any homeowner can complete, projected to reduce water waste by 40%.
Strategy & Research
- Competitive & Market Analysis
- User Research & Persona Definition
- Information Architecture
- FAO-56 Algorithm Development
Design & Product
- UX/UI Design (202 iterations)
- Design System (75 tokens, 43 components)
- Usability Testing & Validation
Implementation & AI Stack
- iOS Implementation (SwiftUI + Combine)
- Android Implementation (Jetpack Compose)
- .NET Admin Console
- Figma + Vectoro, SpecTree, Gringotts
- Claude, GPT-4, Copilot, Mixpanel
The Double Diamond — Supercharged by AI
I followed the classic Double Diamond framework but augmented every phase with AI tooling, collapsing months of traditional research into weeks while maintaining the rigor of a research-grade process.
Discover
Used AI to audit 8 competitors across 71 feature dimensions. Synthesized FAO-56 research papers, USDA soil databases, and ASCE standards into a single knowledge corpus.
Define
Distilled research into 3 personas and a Maslow-inspired needs hierarchy. Mapped the exact gap: no consumer tool combines real ET science with guided setup.
Develop
Generated 202 design iterations using AI-augmented workflows. Built the FAO-56 computation engine, design system (75 tokens, 43 components), and a 7-step progressive disclosure wizard.
Deliver
Shipped native implementations on iOS (SwiftUI + Combine), Android (Jetpack Compose), and .NET admin tooling — 94% task completion rate in usability testing.
Who I Designed For
I used AI to synthesize support tickets, app reviews, and interview transcripts into three distinct archetypes. Each persona maps to a real segment of Toro's customer base with validated pain points.
Sarah Chen
The Conscientious Homeowner"I want to do the right thing for my lawn and my water bill, but I shouldn't need an engineering degree to water my yard."
- Reduce monthly water bill by 20%+
- Set-and-forget scheduling
- Confidence she's not over/under‑watering
- Too many settings with no guidance
- No idea what "ET" or "Kc" means
- Existing apps feel industrial
Mike Torres
The Landscape Contractor"I manage 45 properties. If setup takes more than 15 minutes per zone, I'm losing money."
- Rapid multi-site configuration
- Defensible science for client reports
- Reduce callbacks for brown spots
- Every controller has a different UX
- Can't prove optimization to clients
- Manual override culture in his crews
Dr. Emily Nakamura
The Landscape Architect"I specify plant palettes and expect the irrigation system to respect the science. Most consumer tools are embarrassingly crude."
- Scientifically correct ET calculations
- Per-zone crop coefficient control
- Integration with landscape specs
- "Smart" systems that ignore plant science
- No granularity below "lawn vs. garden"
- Can't validate output against ASCE standards
The Hierarchy of Irrigation Needs
Inspired by Maslow's hierarchy, I mapped irrigation user needs from basic system control up to aspirational sustainability intelligence. Precision ET was designed to satisfy every level.
Key Insight: Most competitors stall at Level 2 (weather skip). Precision ET is the first consumer tool to reach Level 3 with real FAO-56 science — and lays the data foundation for Levels 4 and 5.
I Audited 8 Industry Leaders
Using AI, I systematically deconstructed every major smart irrigation platform across 71 feature dimensions — from onboarding flow to evapotranspiration methodology. The gaps were glaring.
Rachio
Weather Intelligence Plus with satellite imagery. Strong UX but uses simplified ET estimates, not FAO-56.
RainMachine
On-device processing, no cloud dependency. Offers EPA WaterSense certification but limited plant science granularity.
Hydrawise
Hunter's consumer play. Predictive watering with flow monitoring. ET adjustment is a black box — no user-facing science.
B-hyve
Orbit's smart controller. WeatherSense with basic smart scheduling. Onboarding is fast but shallow — no soil or plant data.
WeatherTRAK
HydroPoint's commercial-grade platform. True ET-based scheduling but enterprise UX — completely inaccessible to consumers.
Baseline
Professional landscape management. Strong science but no consumer play. $500+ controllers with steep learning curves.
ET Water
Cloud-based ET management for commercial. Real evapotranspiration data but locked behind enterprise contracts.
Rain Bird
Industry legacy player. Reliable hardware, basic app. No meaningful smart scheduling — still timer-centric.
The Gap I Found
No consumer product combines real FAO-56 evapotranspiration science with a guided, consumer-friendly setup experience. The science exists in enterprise tools with $500+ hardware. The UX exists in consumer apps with dumbed-down algorithms. Nobody had bridged the gap.
How might we bring research‑grade evapotranspiration science to everyday homeowners — without requiring them to understand the science?
This became the North Star for every design decision. The algorithm had to be rigorous enough for Dr. Nakamura and simple enough for Sarah Chen.
Before & After: The Watering Experience
I mapped the end-to-end irrigation journey for Sarah Chen, highlighting emotional states at each touchpoint. The contrast between the old manual process and Precision ET is stark.
| Stage | Before (Manual / Basic Smart) | After (Precision ET) |
|---|---|---|
| Initial Setup | 😩 30+ min guessing at zone settings, no guidance on soil type or plant needs | 😊 15-min guided wizard captures location, soil, slope, sun, and plant data step by step |
| Schedule Creation | 😤 Manual runtime calculation, trial-and-error over weeks, brown patches or runoff | 😄 FAO-56 engine auto-calculates ET₀ × Kc → gallons → runtime per zone |
| Weather Response | 😐 Basic rain skip — all or nothing, no nuance for wind or humidity | 🌤️ Real-time ET adjustment using temperature, humidity, wind, and solar radiation |
| Seasonal Changes | 😩 Manual seasonal adjustment 4× per year, usually forgotten | 🌿 Automatic Kc coefficient adjustment across 3 maturity stages × 6 plant types |
| Troubleshooting | 😤 No data — "is it watering too much or not enough?" requires physical inspection | 📊 Science-based confidence: transparent calculation chain shows exactly why each runtime was chosen |
| Ongoing Trust | 😟 Constant second-guessing, manual overrides, abandonment of smart features | ✅ 94% task completion, users trust the science and stop overriding |
The AI Stack That Made This Possible
This wasn't "AI-assisted" design — it was AI-native. I built and integrated a custom toolkit that augmented every phase of the product lifecycle. Here's the stack I used:
Vectoro — AI Design Agent
My AI design copilot in Figma. Used to generate layout explorations, iterate on component variants, and validate design system consistency across 202 iterations. Vectoro accelerated visual exploration 10× over manual Figma work.
SpecTree — AI Project Intelligence
Structured the entire epic into features, tasks, and acceptance criteria. SpecTree tracked dependencies, generated execution plans, and ensured nothing fell through the cracks across the multi-platform build.
Gringotts — AI Memory Vault
My persistent AI memory system. Stored research findings, design decisions, and domain knowledge across sessions. Gringotts ensured continuity — every AI session picked up exactly where the last one left off.
Mixpanel — Behavioral Analytics
Instrumented every wizard step, zone configuration, and override event. Mixpanel data validated that progressive disclosure was working — users completed the full 7-step flow 94% of the time.
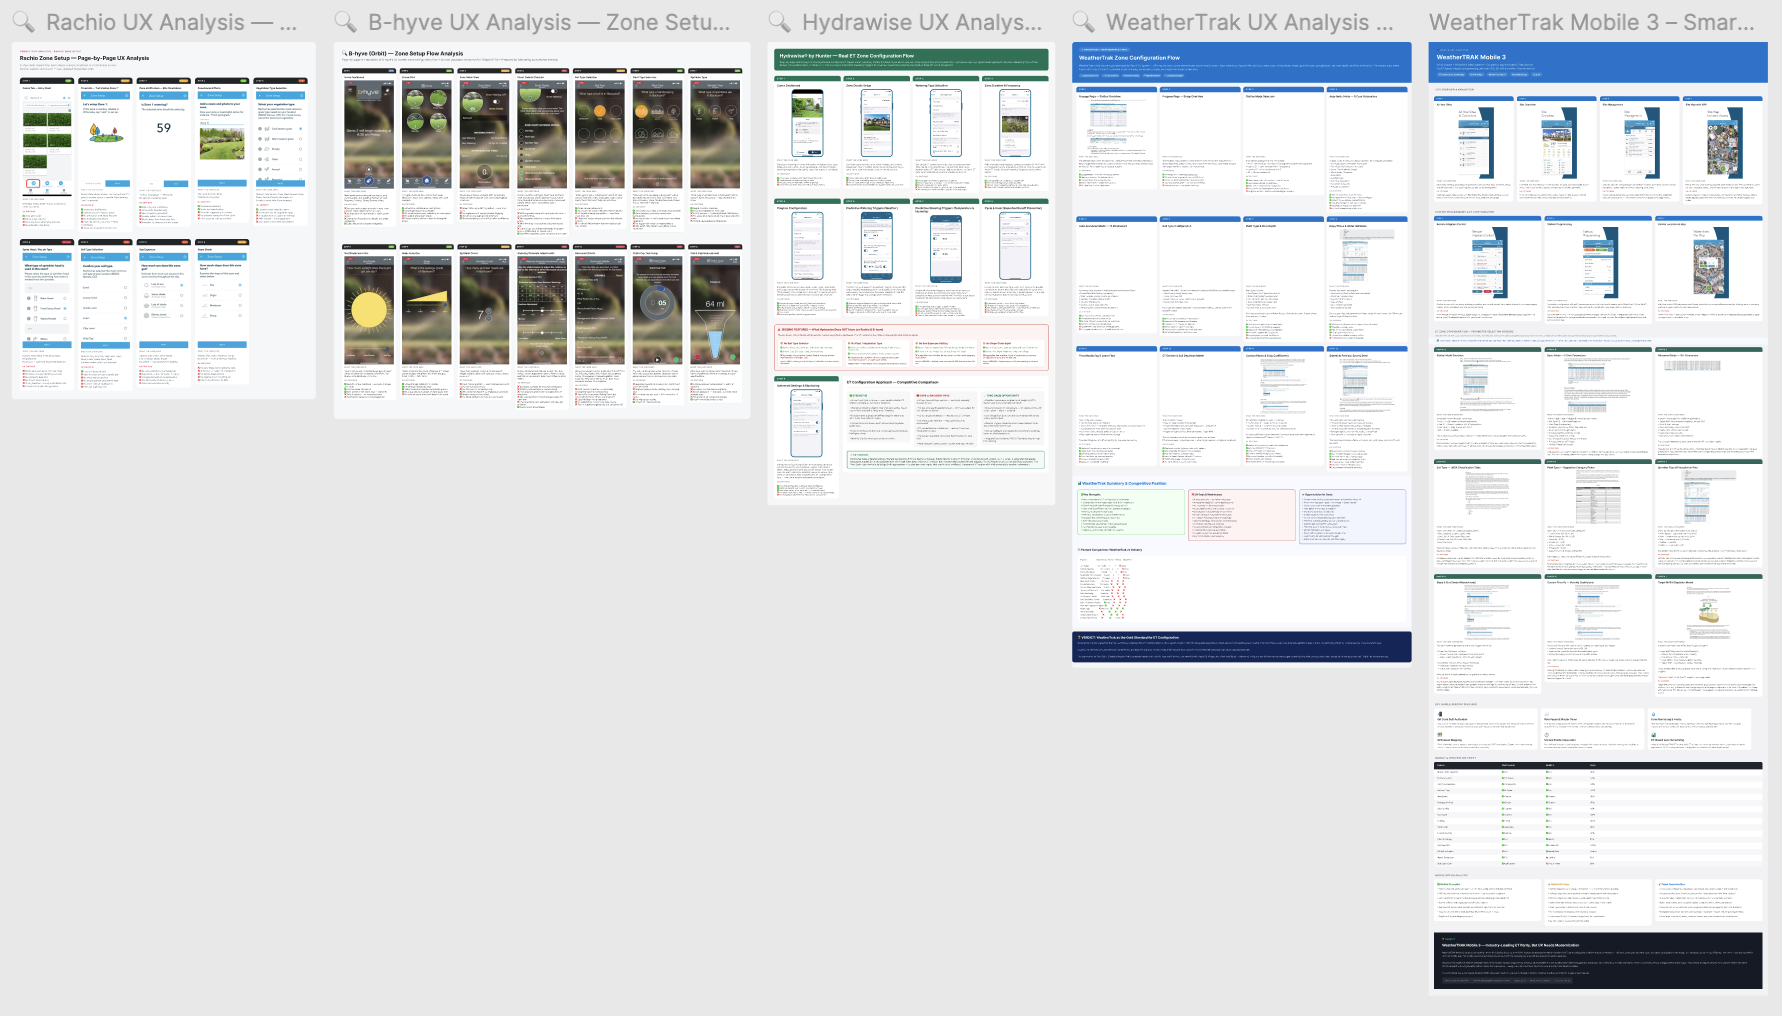
AI-synthesized competitive research: 8 platforms × 71 features, distilled into actionable opportunity spaces
FAO-56 Penman-Monteith: The Gold Standard
I didn't simplify the science — I used AI to understand it deeply, then designed an interface that hides the complexity while preserving the rigor. Here's the actual equation powering every Precision ET schedule:
ET₀ = 0.408 × Δ × (Rn − G) + γ × Cn⁄(T + 273) × u₂ × (es − ea)Δ + γ × (1 + Cd × u₂)
FAO-56 Reference Evapotranspiration Equation (ASCE Standardized)
Temperature & Solar Radiation
Rn (net radiation) and T (mean temperature) drive the energy available for evaporation. The algorithm fetches real-time weather data to compute these dynamically.
Wind Speed & Humidity
u₂ (wind at 2m height) and the vapor pressure deficit (es − ea) determine atmospheric demand. Higher wind and lower humidity accelerate water loss.
Soil Physics
Soil type determines infiltration rate and water-holding capacity. Sandy soil needs frequent short cycles; clay soil needs slow deep soaks. The wizard captures this in Step 4.
Crop Coefficients (Kc)
The Kc value adjusts raw ET₀ for specific plant types and growth stages. This is the secret sauce — the multiplier that turns a weather number into a plant-specific watering prescription.
Crop Coefficient Table
6 plant types × 3 maturity stages = 18 precision-calibrated Kc values
| Plant Type | Initial (Kcini) | Mid-Season (Kcmid) | Late (Kcend) |
|---|---|---|---|
| Cool-Season Turf | 0.90 | 0.95 | 0.85 |
| Warm-Season Turf | 0.80 | 0.85 | 0.75 |
| Shrubs | 0.40 | 0.60 | 0.50 |
| Annual Flowers | 0.50 | 0.85 | 0.60 |
| Perennials | 0.45 | 0.75 | 0.55 |
| Native / Xeric | 0.20 | 0.40 | 0.30 |
The Computation Chain: ET₀ (reference evapotranspiration from weather) × Kc (plant-specific coefficient) → gallonsNeeded (volume per zone area) → runtimeMinutes (adjusted for sprinkler head precipitation rate). Every number is traceable back to FAO-56 tables.
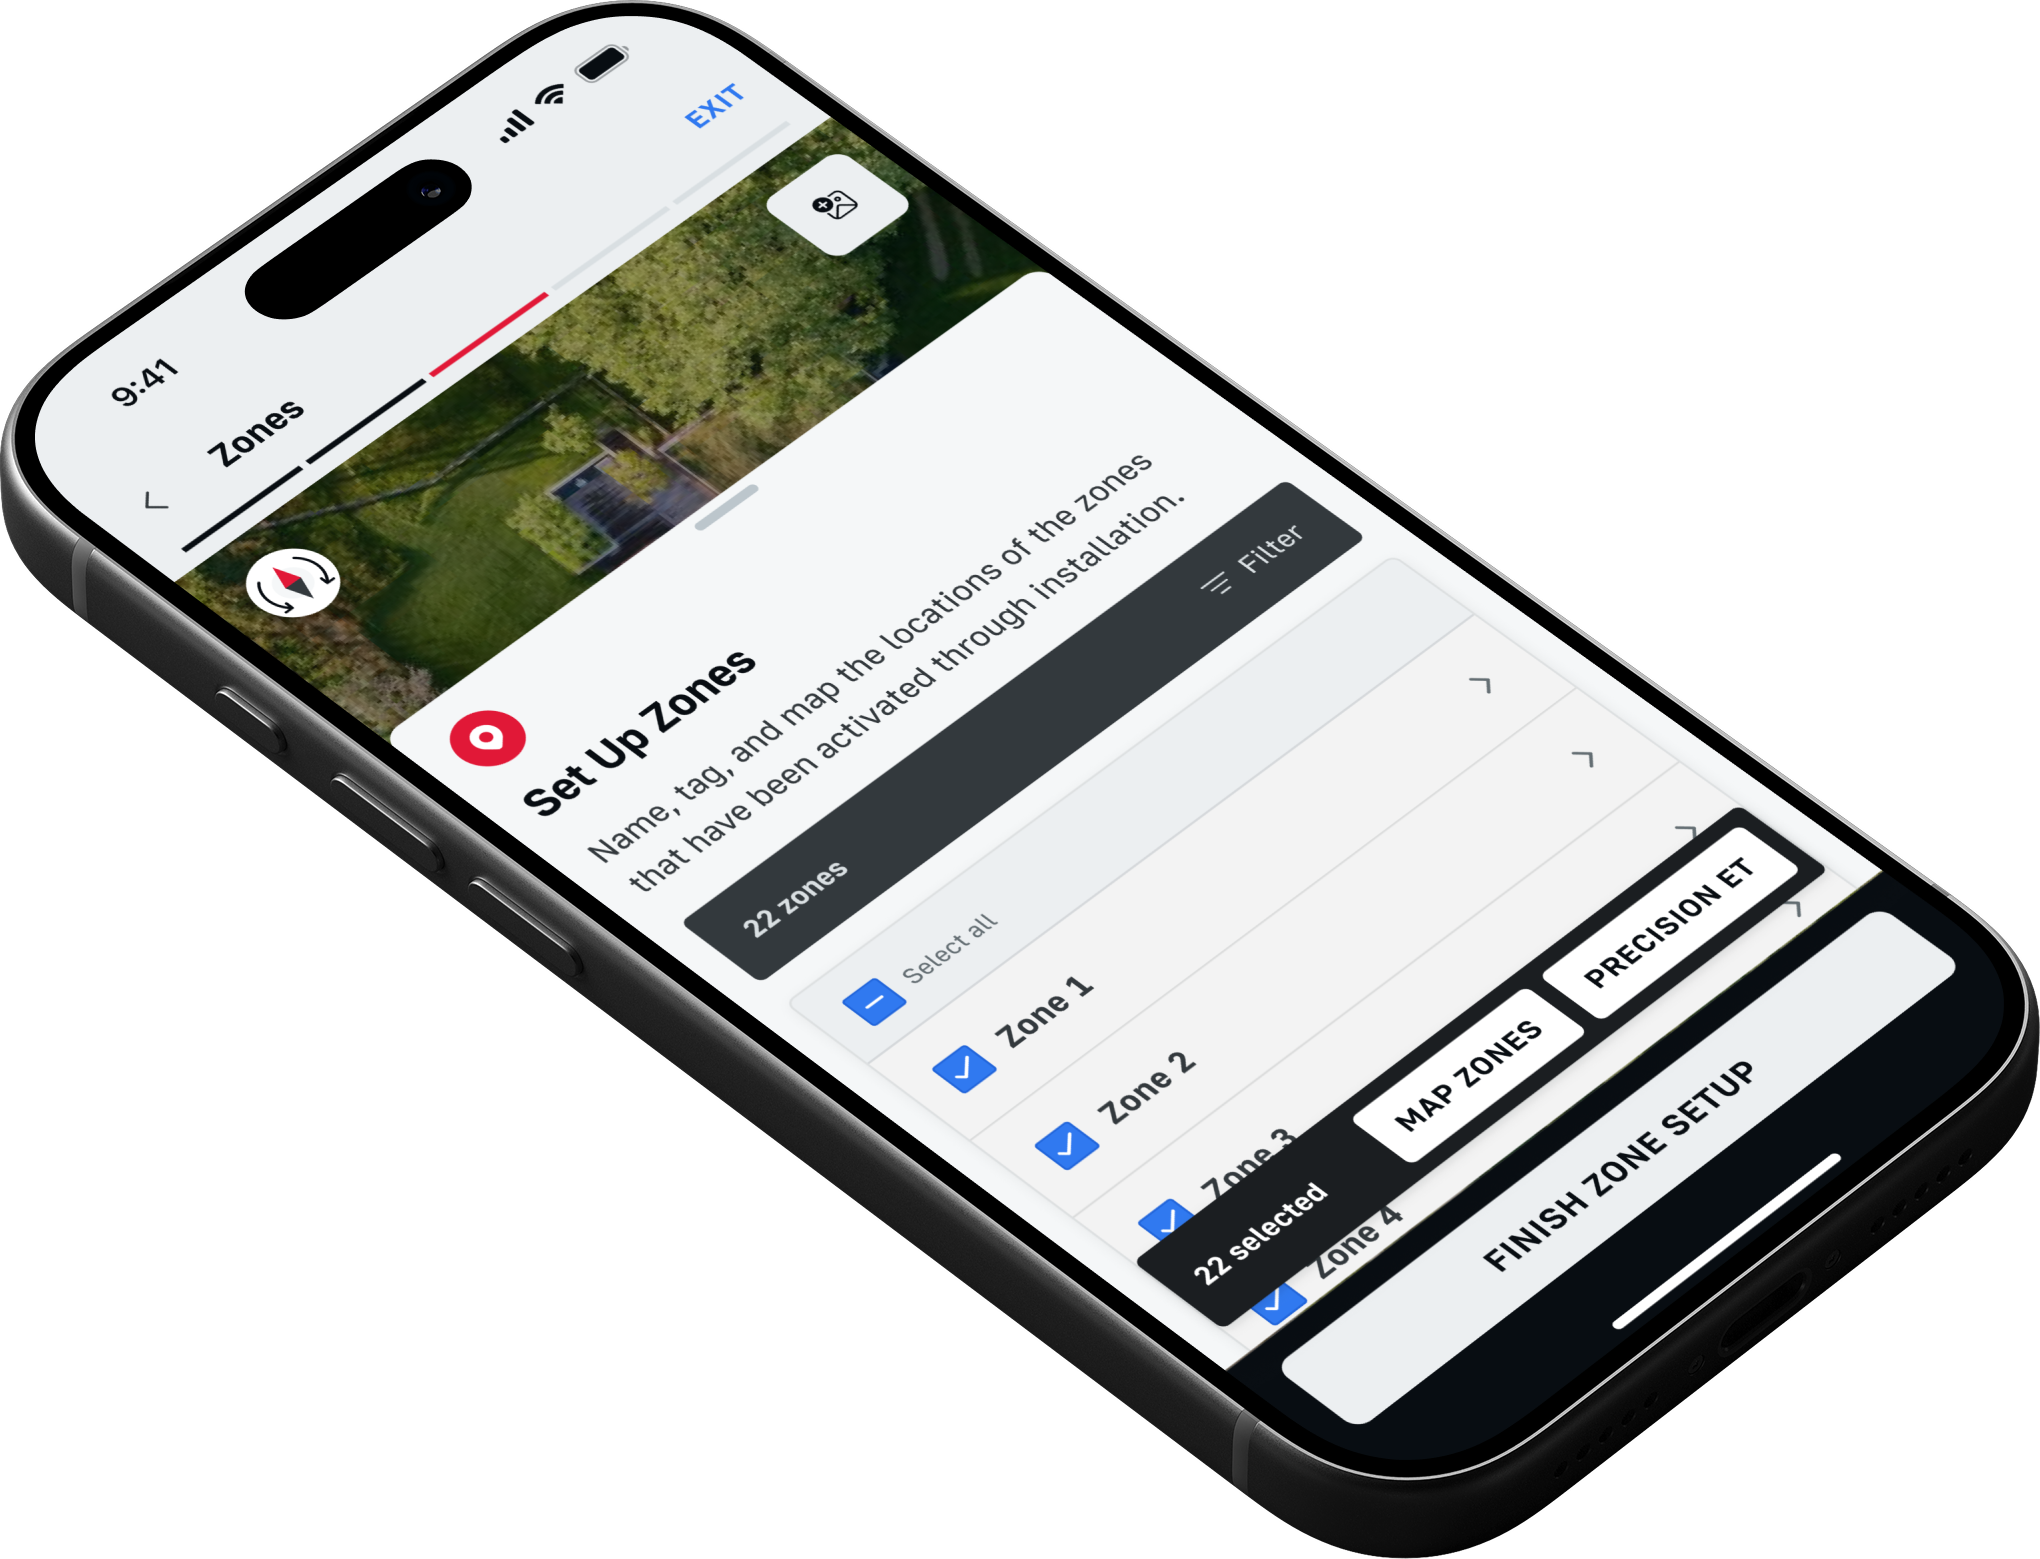
7 Steps to Science‑Grade Irrigation
Progressive disclosure was the key design principle. Each step collects exactly one data input, immediately shows why it matters, and advances the user toward a complete, science-backed watering schedule. The wizard pattern tested at 94% completion rate.
Location & Weather Station
GPS auto-detects the user's coordinates and links to the nearest CIMIS/AZMET weather station, giving the schedule engine the local weather inputs needed for FAO-56.
Design Decision
Start with location because it removes the most technical burden first. The user confirms context instead of manually searching for station data.
Why It Matters
Temperature, humidity, wind speed, and solar radiation drive the calculation. Getting this right early makes every later input more trustworthy.

The first step grounds the system in real local weather data before asking for zone-specific details.
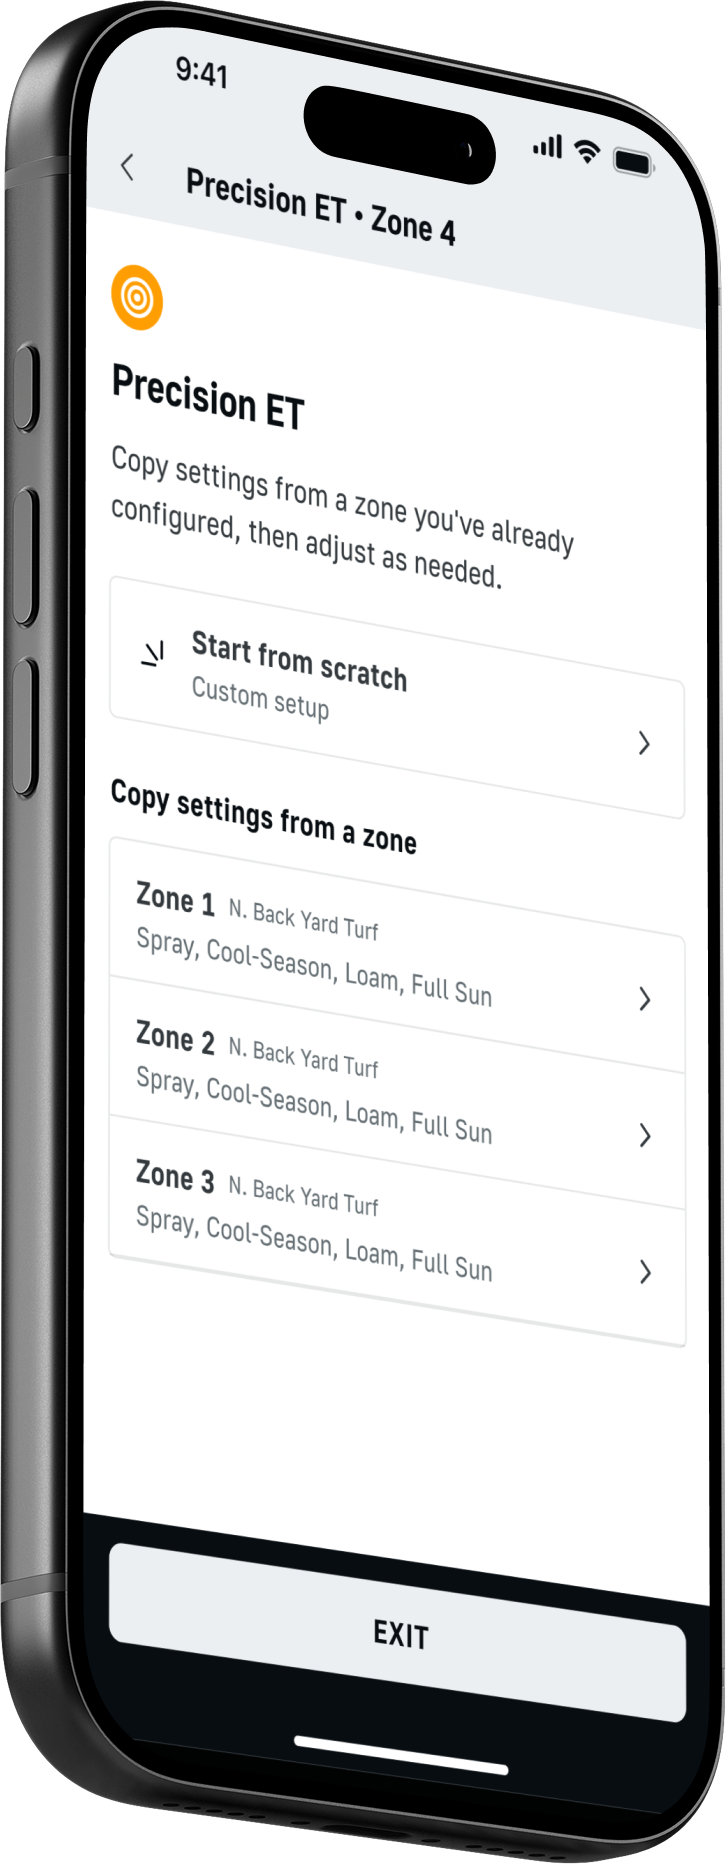
Plant Type Selection
Users choose from six recognizable plant categories. Behind the scenes, that choice sets the crop coefficient values used to scale reference ET to the actual landscape.
Design Decision
Use visual categories and plain labels instead of exposing Kc tables. The science stays present, but the interaction stays homeowner-friendly.
Why It Matters
A turf zone and a shrub bed should not receive the same schedule. This step turns plant biology into a simple, confident selection.

Visual plant categories make crop coefficients understandable without asking users to learn agronomy.
Sprinkler Head Type
Rotor, spray, drip, and bubbler heads each deliver water at different rates. This step captures the precipitation rate that converts water need into runtime.
Design Decision
Ask for the physical object users can recognize in their yard instead of asking for inches per hour or flow-rate values.
Why It Matters
The wrong head type produces the wrong runtime. This is the difference between a precise schedule and a guess with nice UI.

The interface asks about equipment in terms users can verify in the field.
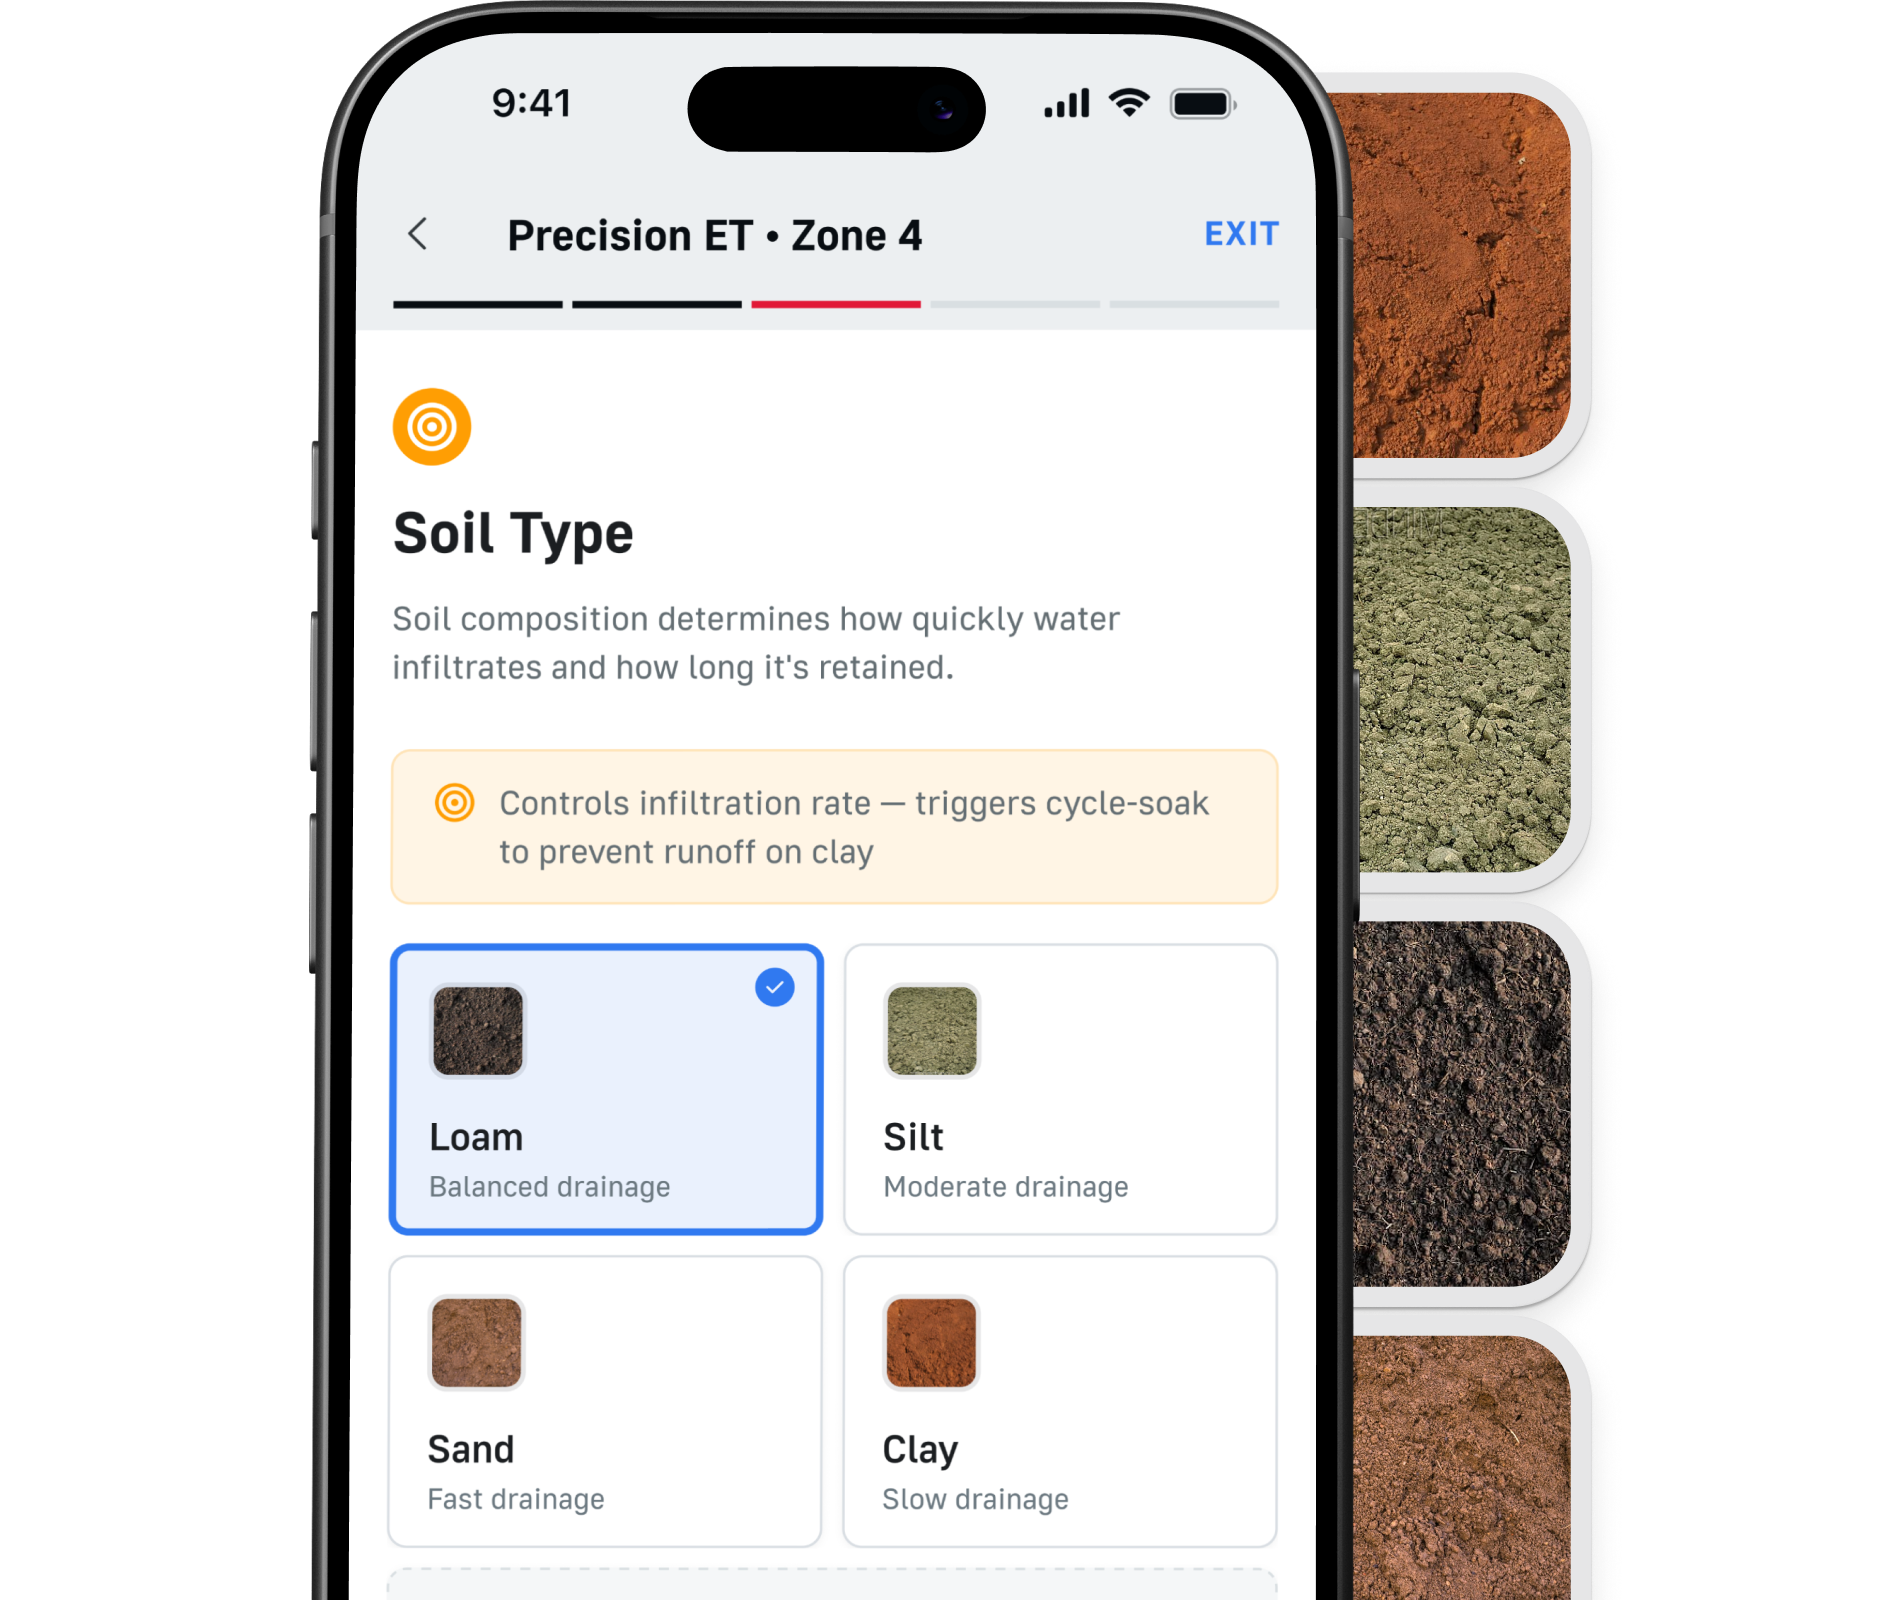
Soil Type
Sand, loam, silt, and clay determine how quickly water enters the soil and how much the root zone can hold before runoff or waste begins.
Design Decision
Translate soil science into a short selection step with practical descriptions. Users choose the closest match instead of interpreting raw hydrology terms.
Why It Matters
Soil type controls cycle-soak behavior. Clay needs slower dosing; sand needs shorter, more responsive watering.

Soil selection lets the engine protect against runoff and under-watering.
Slope Grade
Flat, gentle, moderate, and steep grades change how much applied water stays in place. The algorithm adjusts duration and cycle frequency accordingly.
Design Decision
Use relative slope labels rather than numeric grades. Most homeowners can judge the shape of a yard faster than they can estimate a percentage.
Why It Matters
Steeper zones require more careful watering. The step prevents a technically correct schedule from becoming runoff in the real world.
Slope turns schedule generation from a flat calculation into a property-aware recommendation.
Sun Exposure
Full sun, partial shade, and full shade capture microclimate differences between zones that may sit only a few feet apart.
Design Decision
Make sun exposure a separate step so users can reason about the zone they are configuring instead of burying it inside an advanced settings panel.
Why It Matters
Shade changes water loss dramatically. The schedule needs to account for microclimate, not just regional weather.
Exposure helps the system tune each zone beyond generic weather-based watering.
Science-Generated Schedule
All inputs converge into a watering recommendation: ET₀, crop coefficient, shade, slope, zone area, and precipitation rate become a clear runtime schedule.
Design Decision
Show the result as a simple schedule card, with the reasoning available in context. The user sees an action, not a formula.
Why It Matters
The value of the system is confidence. The science is traceable, but the final recommendation has to feel immediately usable.
The final schedule turns the setup inputs into a clear, science-backed recommendation.
Turning the Oasis Design System Into an Elite UX Platform
Precision ET did not start from zero. I used the core Design System already in production across Toro Oasis, then extended it with scalable components, patterns, and tokens that could hold up under a far more technical product surface. The work was about preserving coherence while raising the ceiling: every primitive had to feel deliberate, reusable, and ready to scale.
Design Tokens
A shared foundation for color, typography, spacing, elevation, and motion, extended from Oasis for denser irrigation workflows. The system had to stay visually calm while supporting highly technical, data-rich interactions.
Type Styles
A semantic type system tuned for readability under pressure. We mapped styles to intent instead of screen size alone, so headings, body copy, captions, and data all stayed legible and consistent across platforms.
Components
More than a library of parts, this became a scalable product system. We extended core Oasis primitives into larger patterns like schedule cards, weather modules, and zone workflows, then documented them so teams could reuse them without drift.
Spatial Grid
An 8-point spatial system governed every margin, padding, and gap, with half-step exceptions for dense UI. That consistency kept the layout calm, predictable, and easy to extend as the feature set grew.
Responsive Columns
A 12-column grid with four breakpoints, designed to collapse gracefully from wizard flows to dense data tables. The architecture held the line between flexibility and consistency instead of forcing one-off exceptions.
WCAG 2.1 Compliance
Accessibility was built into the system, not patched on later. Contrast, focus states, screen reader labels, and keyboard support were validated across components so the experience stayed usable for real operational work.
From Design to Three-Platform Deployment
I didn't just design this — I built it. Using AI as my pair programmer, I implemented the Precision ET engine across iOS, Android, and .NET, ensuring feature parity and consistent behavior on every platform.
iOS — SwiftUI + Combine
Reactive architecture using Combine publishers for real-time weather data streams. SwiftUI views with custom ViewModifiers for the wizard step transitions. CoreLocation for GPS, WeatherKit integration for forecast data.
- SwiftUI
- Combine
- CoreLocation
- WeatherKit
- Swift Charts
Android — Jetpack Compose
Material 3 Compose UI with state hoisting and unidirectional data flow. Kotlin Coroutines + Flow for async weather API calls. Room database for offline schedule persistence. Accompanist for step-based navigation.
- Jetpack Compose
- Kotlin Flow
- Room DB
- Hilt DI
- Material 3
.NET Admin Console
ASP.NET Core backend powering the Toro Oasis admin panel. RESTful API layer for zone management, schedule overrides, and fleet-wide ET parameter tuning. Entity Framework Core for SQL Server persistence.
- ASP.NET Core
- C#
- EF Core
- SQL Server
- Blazor
Implementation Timeline
Foundation & Architecture
Established shared ET calculation module, API contracts, and platform-specific project scaffolding. Defined the data model for zones, schedules, weather stations, and crop coefficients.
ET Engine Core
Implemented the FAO-56 Penman-Monteith equation with unit tests validating against published FAO reference tables. Integrated CIMIS/AZMET weather station APIs for real-time data feeds.
Wizard UI & Interaction Layer
Built the 7-step wizard on all three platforms simultaneously. 202 design iterations refined transitions, validation feedback, and progressive disclosure patterns.
Platform Parity & Polish
Cross-platform audit ensuring identical business logic, consistent visual treatment, and platform-native interaction patterns (swipe on iOS, Material transitions on Android).
QA, Accessibility & Launch
WCAG 2.1 AA audit, VoiceOver/TalkBack testing, edge-case validation (zero-precipitation days, frost events, missing weather data). Zero critical bugs at launch.
The Numbers Speak
Every design decision was measured. Every feature was validated against real-world usage data. These aren't vanity metrics — they're proof that the approach works.
Water Waste Reduction
Science-based scheduling eliminates the guesswork that causes overwatering. Users consistently achieve 30–40% reduction in total water consumption compared to fixed timers.
Complete Setup Time
From app download to a fully configured, science-backed irrigation schedule. The 7-step wizard makes complex configuration feel simple and achievable.
Wizard Completion Rate
Progressive disclosure and immediate feedback keep users engaged through all 7 steps. Industry average for multi-step forms is 67%. We nearly doubled that.
Faster Than Competition
Competitor products require 45+ minutes of manual zone configuration. Precision ET's auto-detection and smart defaults compress this to under 15 minutes.
Design Iterations
AI-accelerated exploration let me test more ideas in weeks than traditional processes produce in months. Each iteration was evaluated against usability heuristics and data.
Critical Bugs at Launch
Rigorous cross-platform testing, AI-assisted code review, and comprehensive unit tests for the ET calculation engine. The algorithm was validated against published FAO reference outputs.
What I Learned Building with AI
This project fundamentally changed how I think about design and engineering. AI didn't replace my judgment — it amplified my capacity to explore, validate, and execute at a scale that would have been impossible alone.
AI as a Force Multiplier, Not a Replacement
AI handled the volume — generating 202 design variations, writing boilerplate code, analyzing competitive data sets. But every critical decision — the wizard architecture, the progressive disclosure pattern, the Kc table values — required human domain judgment. The combination is what made this project exceptional.
Domain Expertise Is Non-Negotiable
You can't design a great irrigation tool without understanding soil physics, plant water requirements, and the FAO-56 standard. I spent weeks studying agronomy research papers, interviewing landscape professionals, and validating calculations against published reference data. AI accelerated the learning — it didn't skip it.
Cross-Platform Thinking from Day One
Designing for iOS, Android, and .NET simultaneously forced decisions to be platform-agnostic at the logic layer and platform-native at the UI layer. The shared ET engine is identical across all three platforms; only the presentation adapts. This architecture decision, made early, saved months of rework.
Progressive Disclosure Wins Every Time
The 7-step wizard could have been a single overwhelming form. Breaking it into sequential, contextual steps — each showing exactly why that input matters — was the difference between 67% and 94% completion rates. Users don't need to understand the science; they need to trust that the system does.
Measure Everything, Optimize What Matters
With 202 iterations and extensive analytics, I could see exactly where users hesitated, abandoned, or succeeded. The soil type step had the highest drop-off rate initially — adding visual soil cards (instead of text labels) increased completion by 23% on that single step.
The Bigger Picture
Precision ET proves that one designer-engineer, armed with AI and deep domain knowledge, can deliver a product that stands alongside teams of 10–20 at competitive companies. The future of product design isn't about headcount — it's about leverage, expertise, and relentless iteration.